Principal Financial Design System & Data Visualization Revamps
Oversaw the design system and data visualization revamps to ensure both initiatives are tracking momentum and their roadmaps are well-aligned on the high-level. Facilitated various workshop and work sessions series to advocate, inform, educate teams on the new design system and the new data visualization solutions.
Role
- Design System Lead
Data Visualization
Challenge
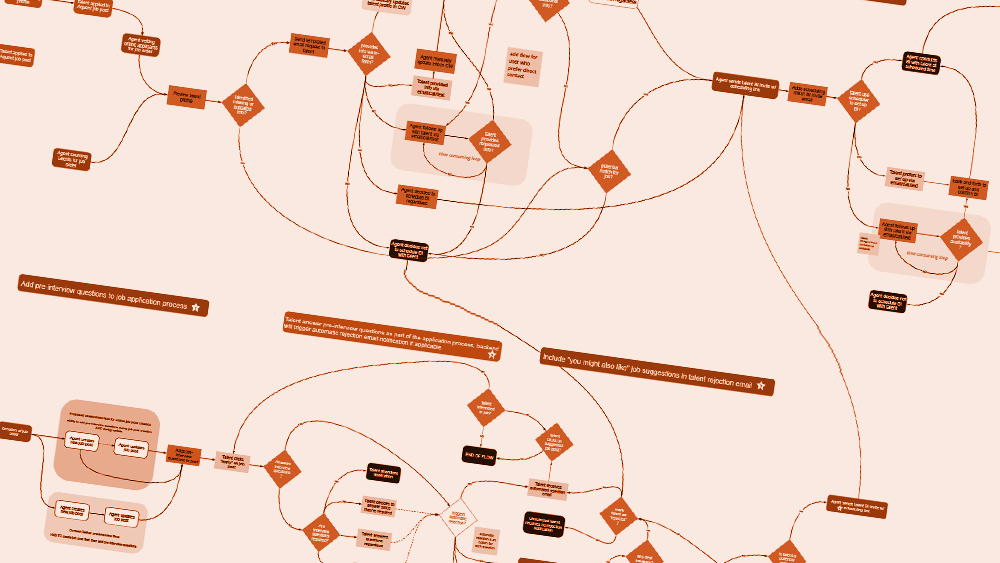
The existing data visualization color palette and chart components at Principal Financial lack the flexibility and coverage needed to support diverse product team requirements. As a result, multiple teams have created their own visualization solutions, leading to inconsistent user experiences, noncompliance with accessibility standards, and varying degrees of brand alignment.
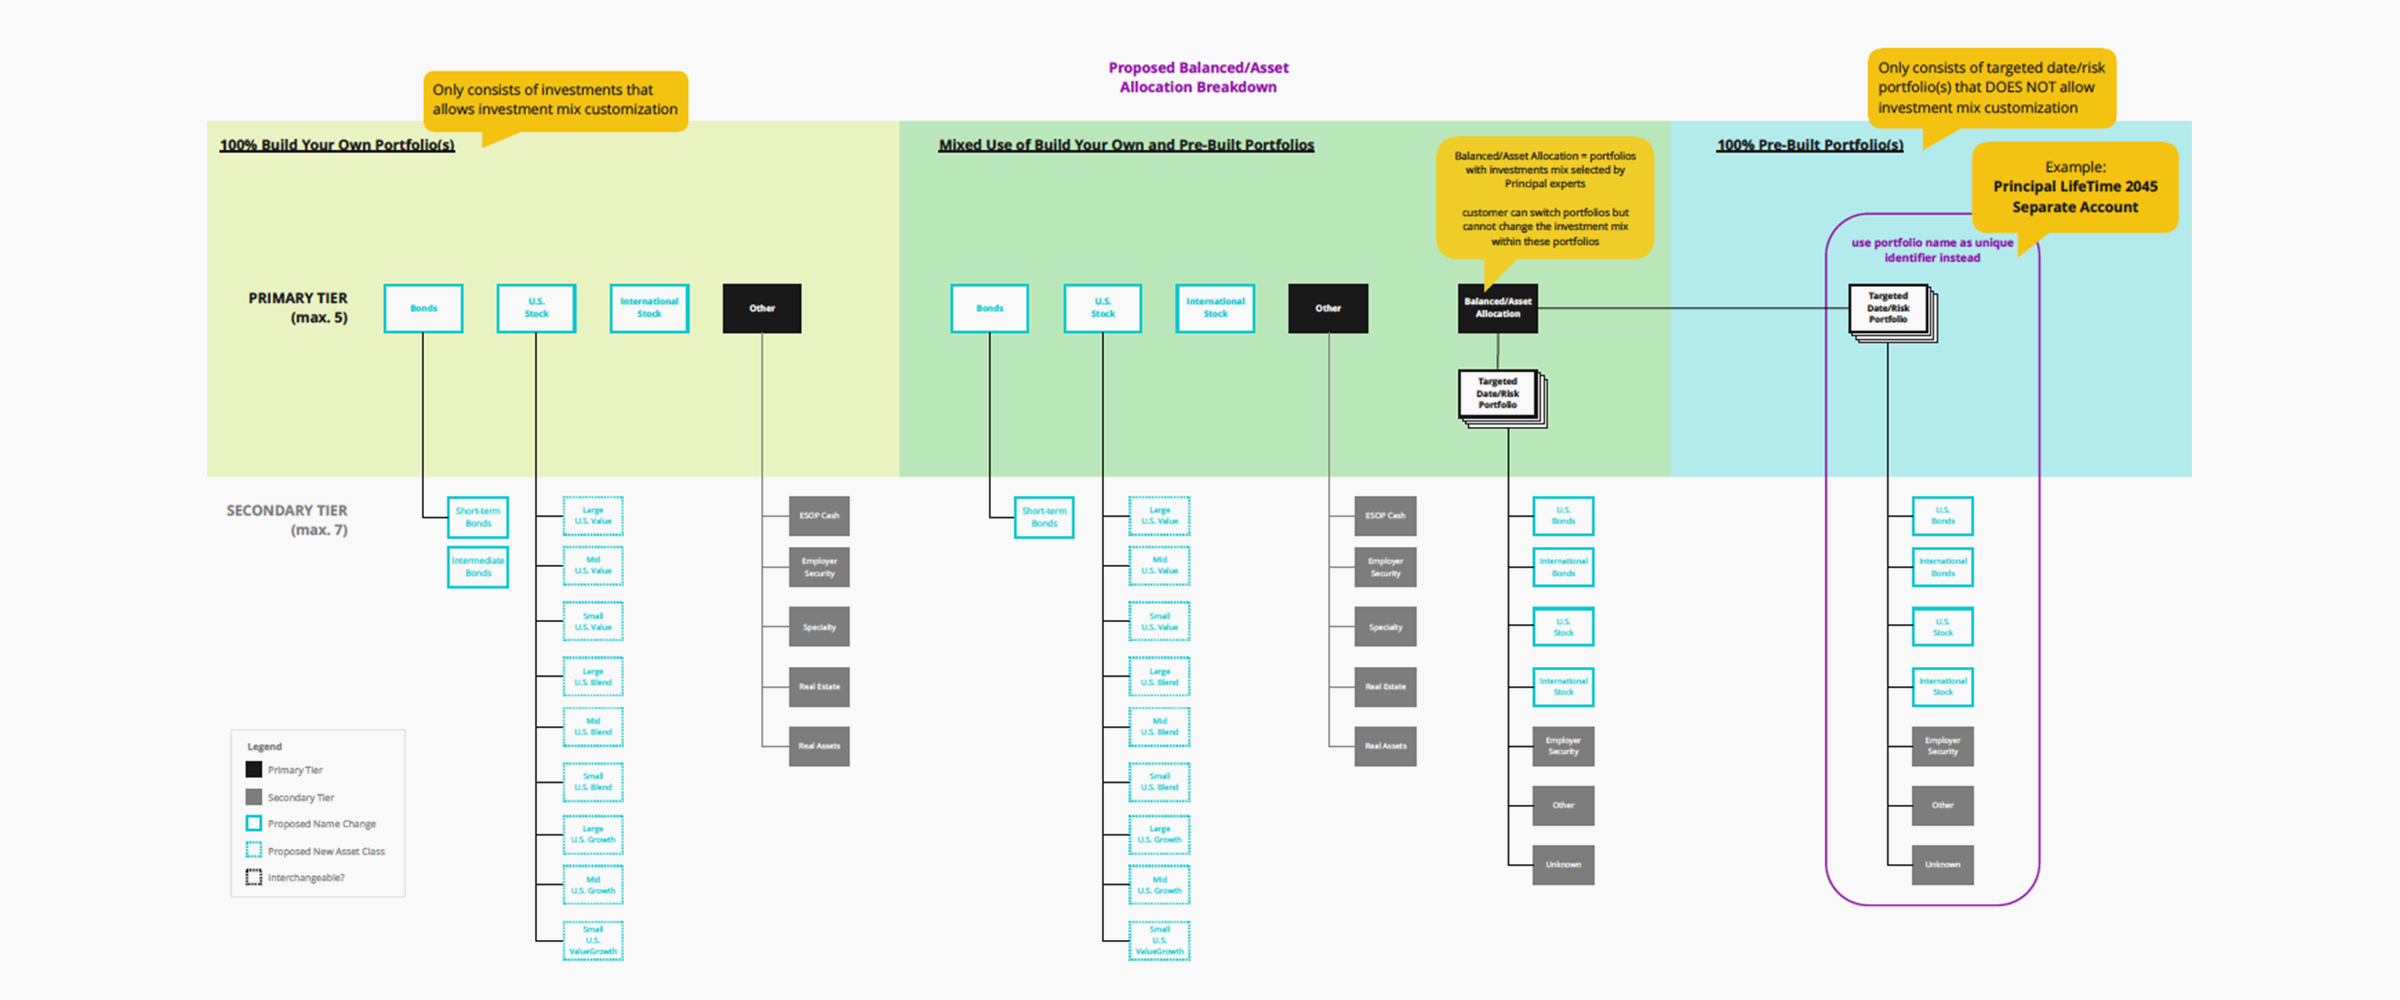
new structure to visualize investment asset classes
Solutions
advocation for project green light
- collaborated with CX team to identify current pain points from organizational perspective
- presented findings to stakeholders and leadership for project green light
- presented findings to brand team and data team for collaboration support
problem framing
- thorough research to ensure updated data visualizations and charts are accessibility-compliant while brand-consistent
- consulted SMEs to understand technical nuances of financial data
- consulted with data analytical to learn about technical constraints, organizational needs, and customer data usage
- interviewed product teams with data visualization needs to understand their pinpoints and priorities
- conducted user testings to understand user pain points
- formulated design hypotheses based on the above
problem solving
- presented initial design hypotheses with low-fidelity prototypes to product SMEs, data analysis team, product owners, design leadership
- revised design hypotheses based on feedback
- conducted color testings for usage in digital and print, simulated color combinations for various types of color blindness
- revised proposed color palette and charts based on accessibility testing and simulation results
execution
- created fluid iterative implementation roadmap
- presented business incentive focused project plans to obtain product team buy-ins to update data visualization experiences
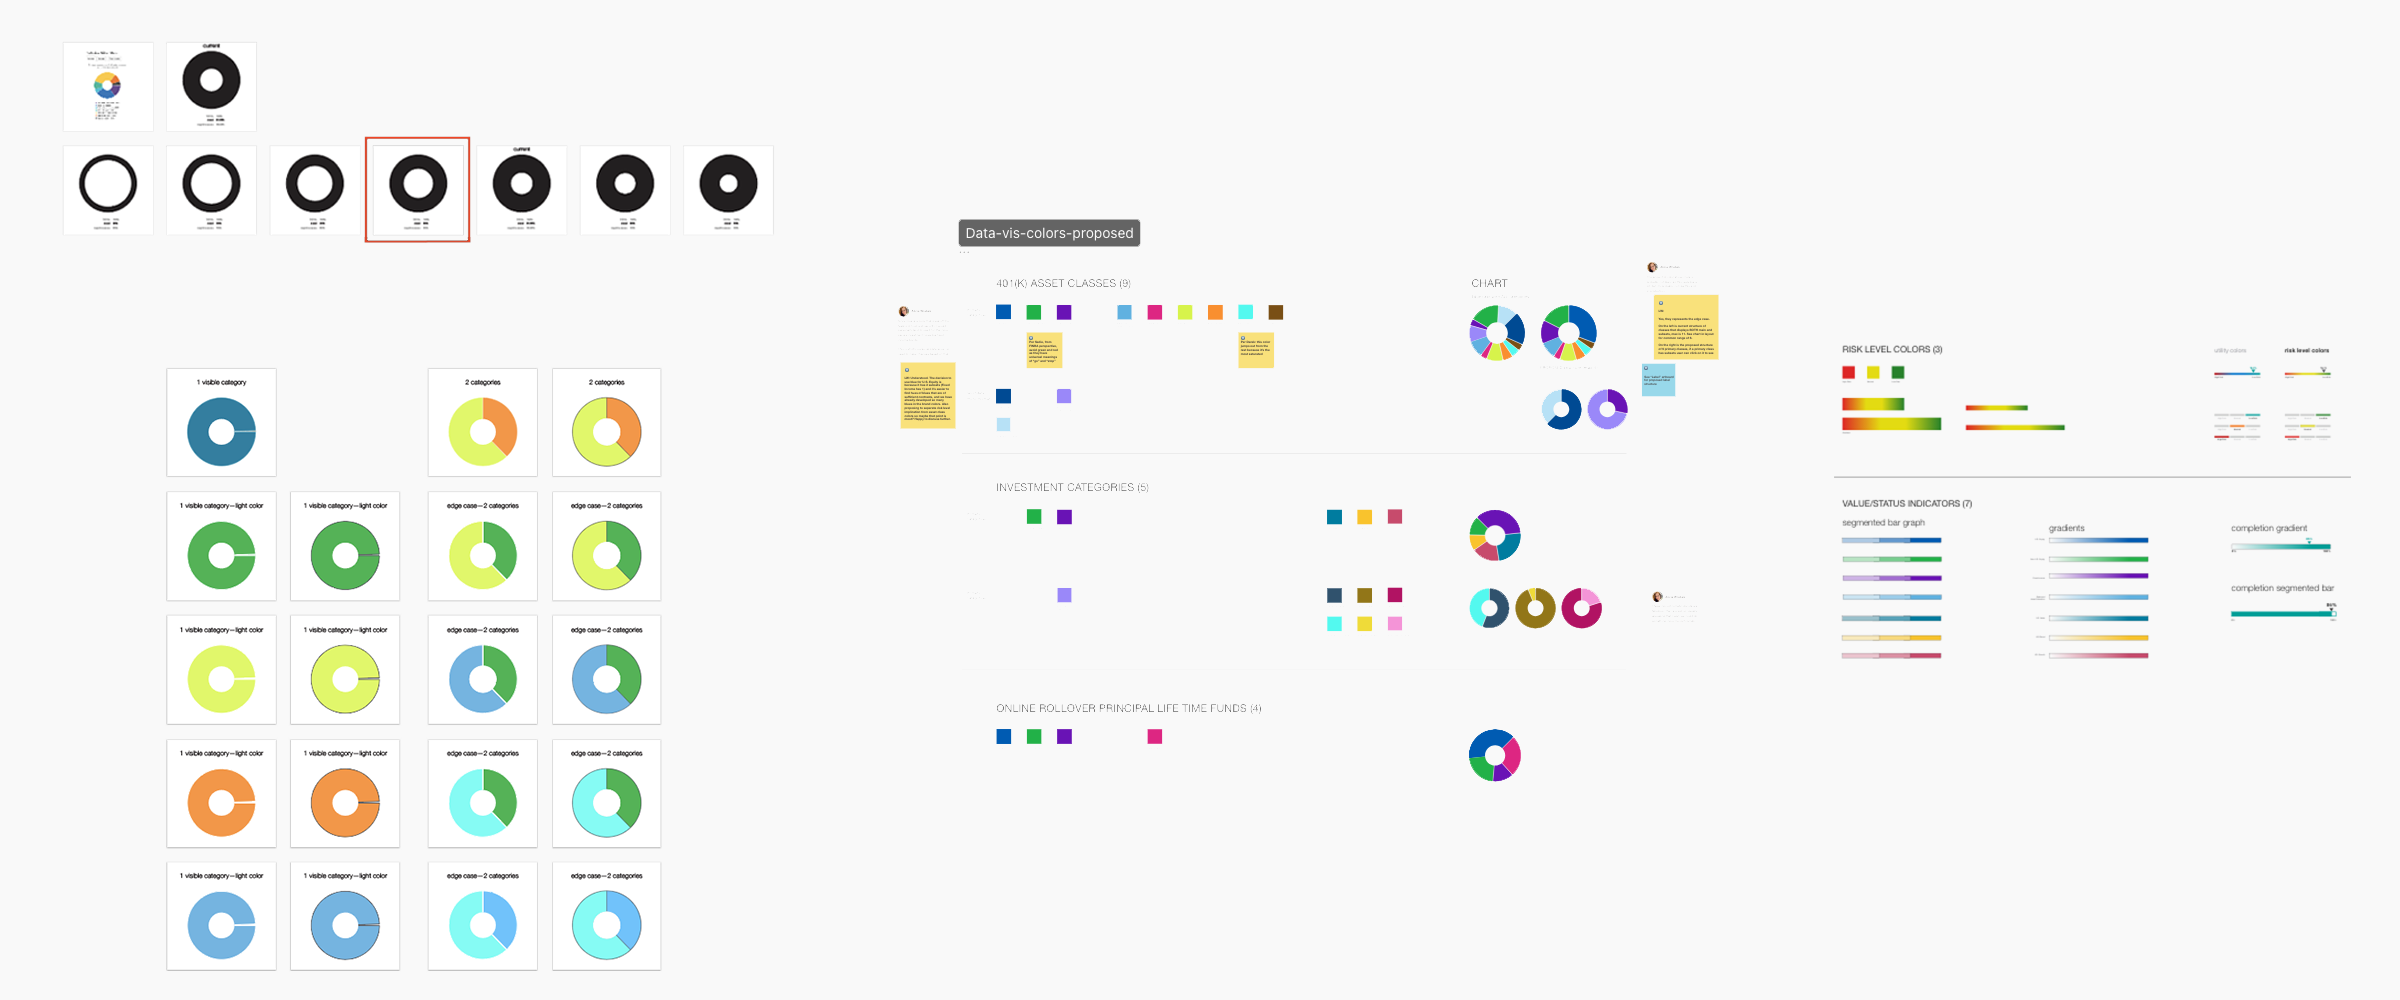
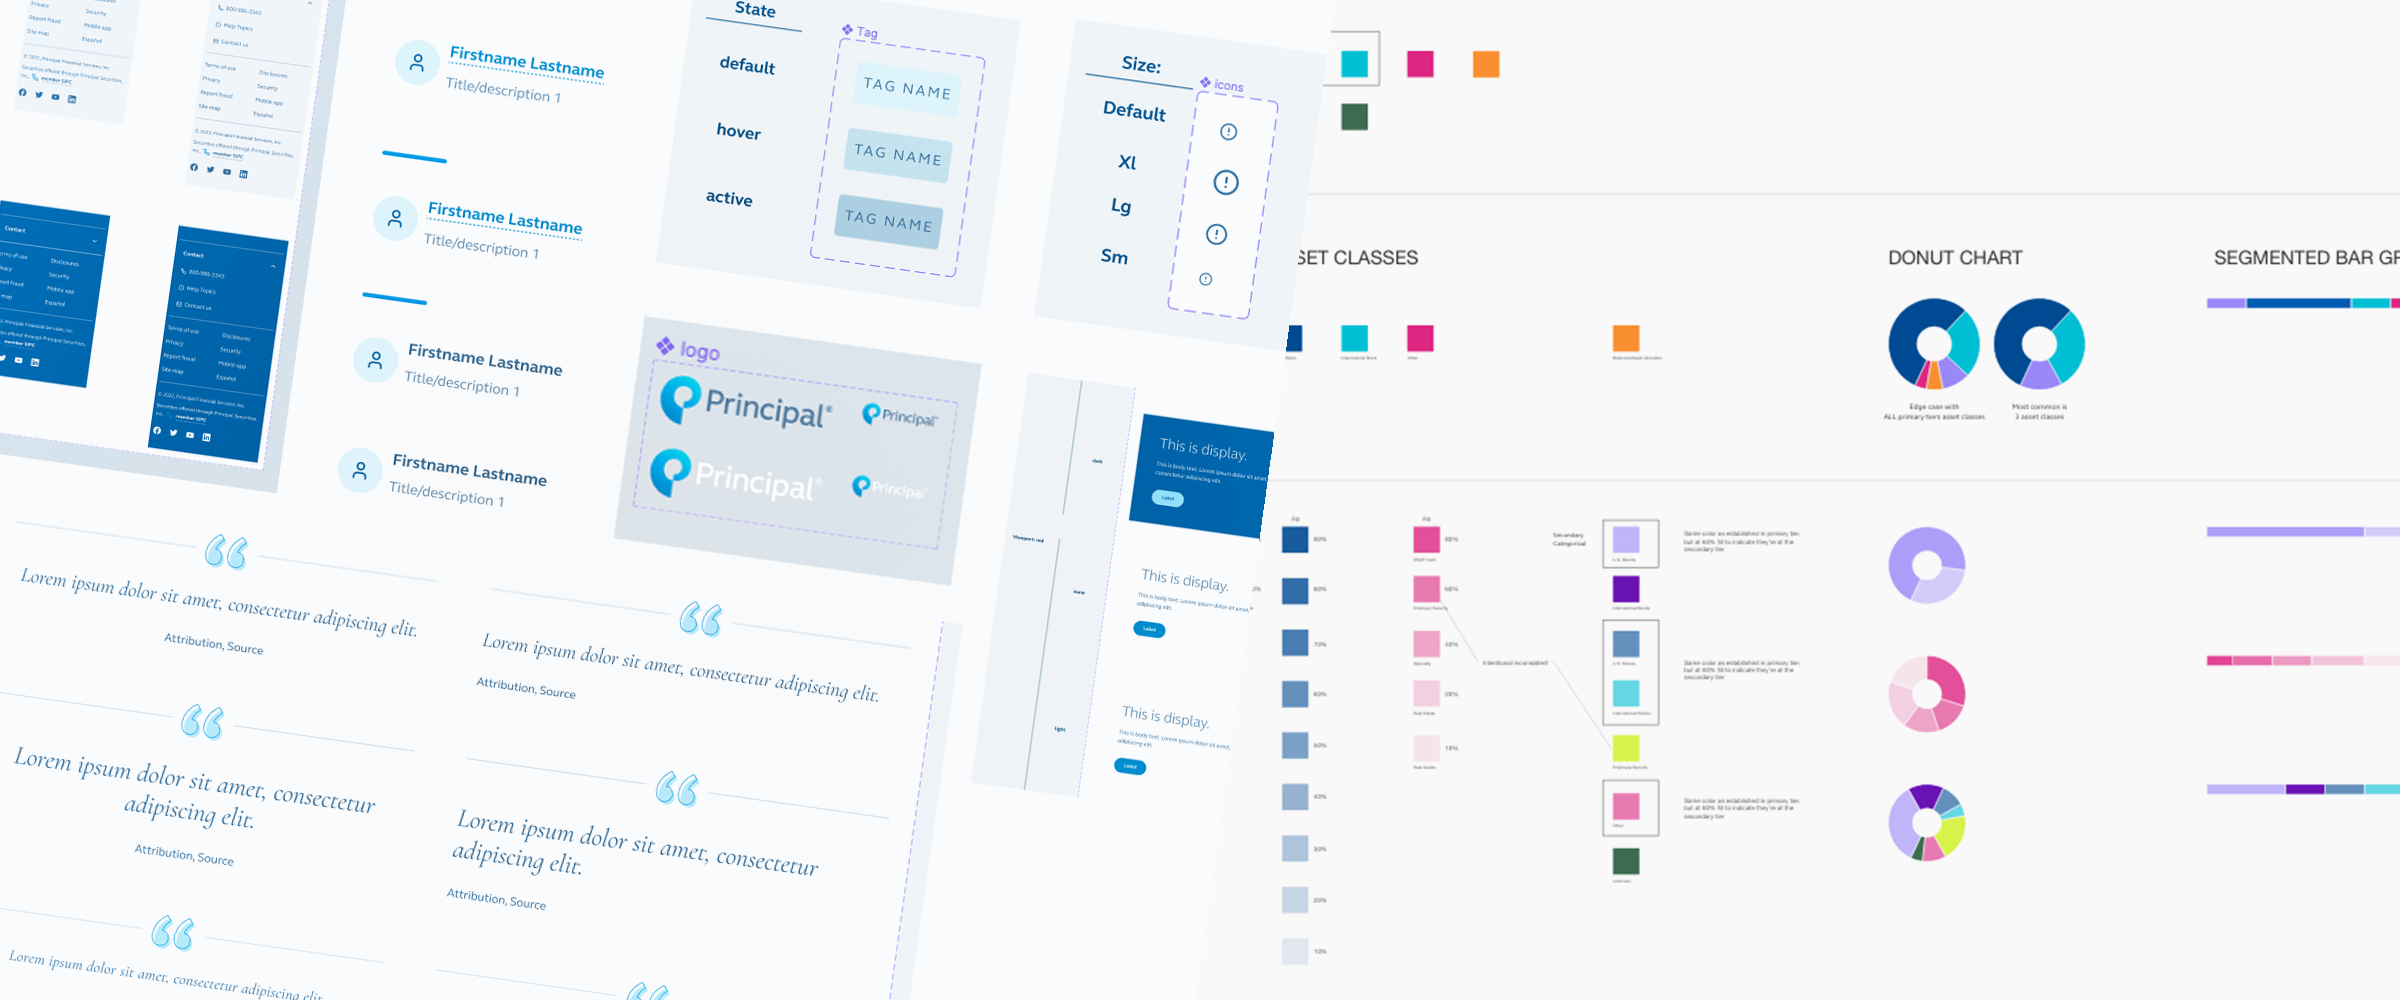
color palette and charts exploration
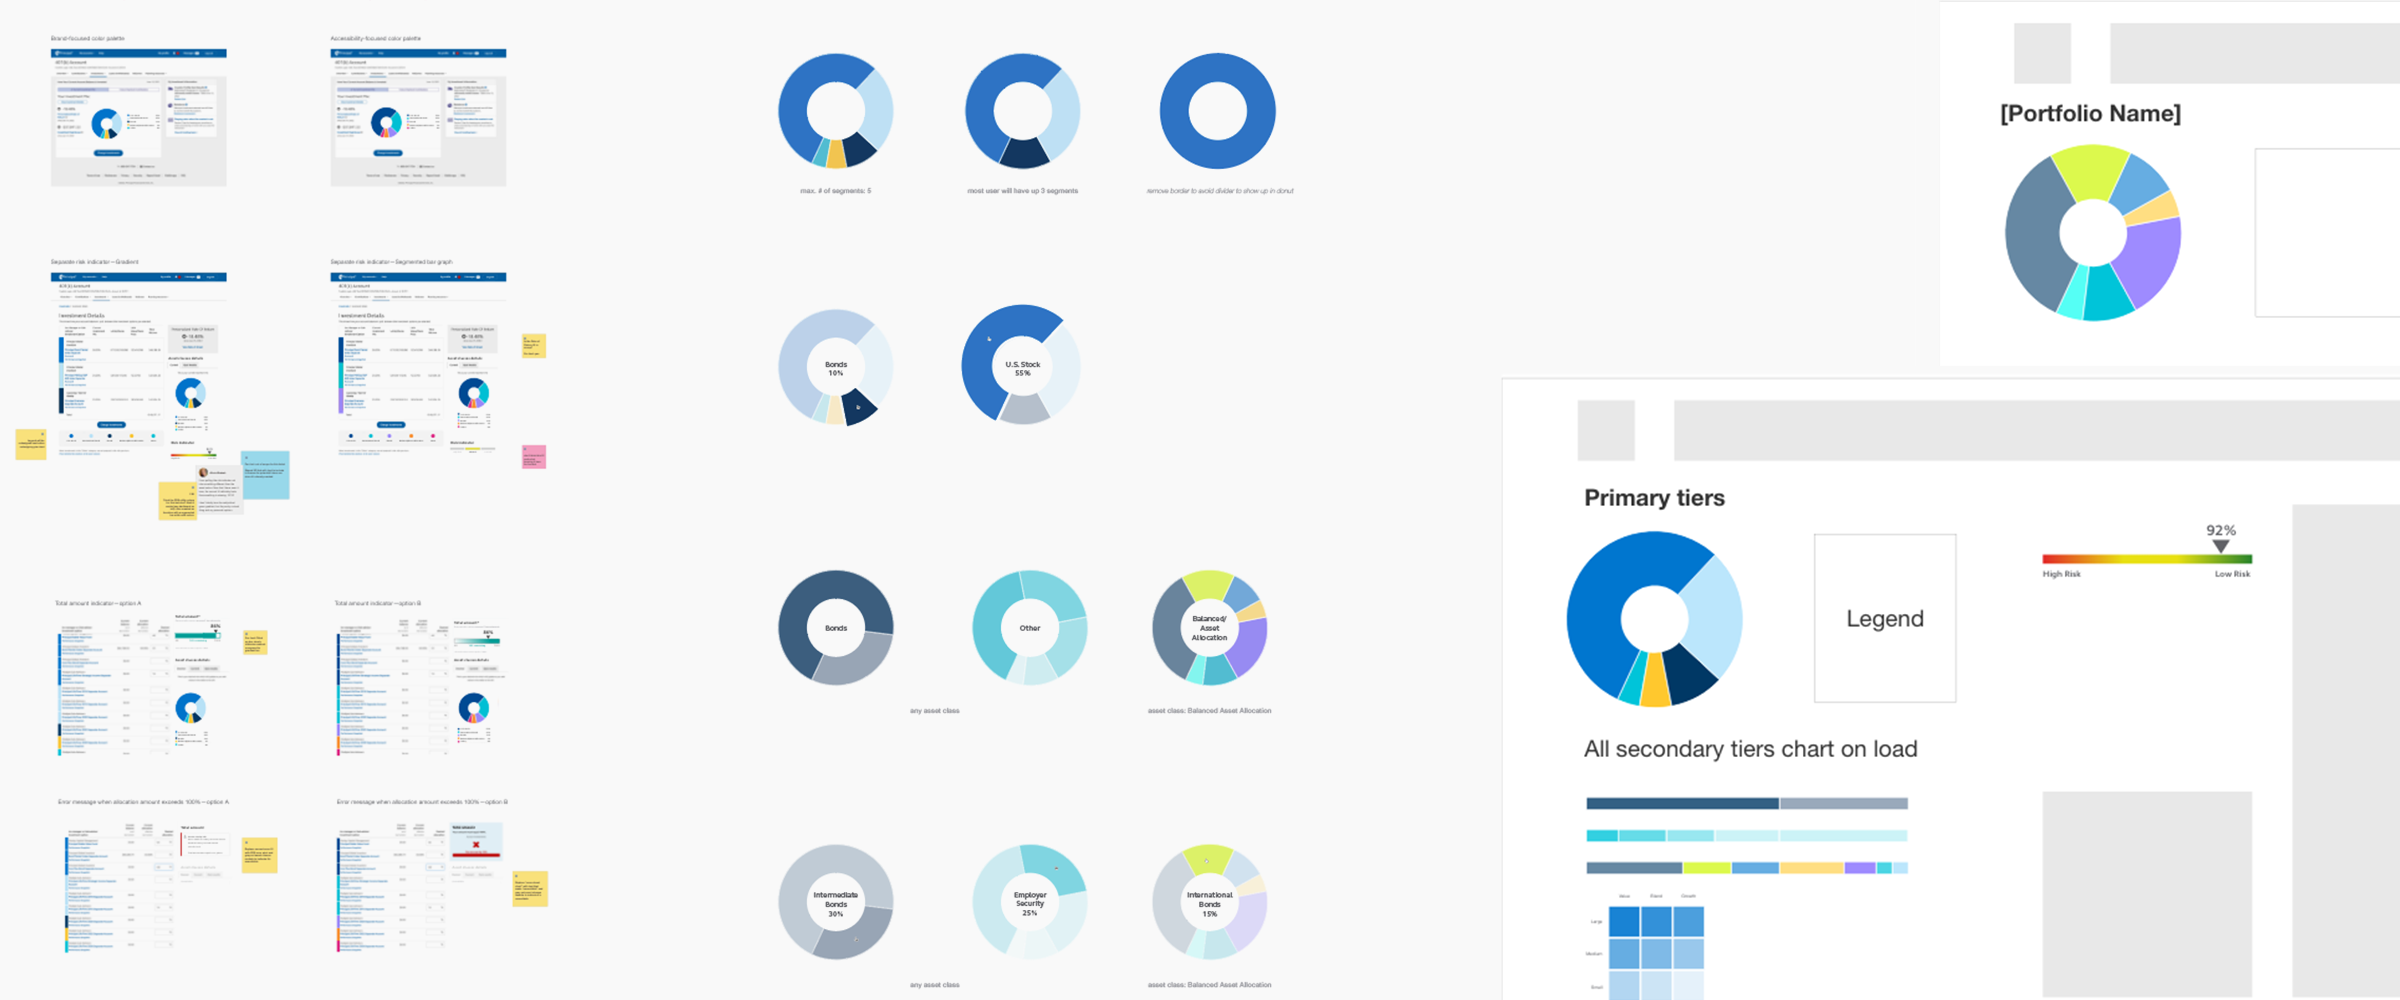
proposed color palette and chart usage
Design System
Challenges
The 4-year old design system was exhausted by growing needs as more teams are adopting, consuming, and contributing to the design system. New strategies, structure, governance, and processes are needed to support the increased consumption.

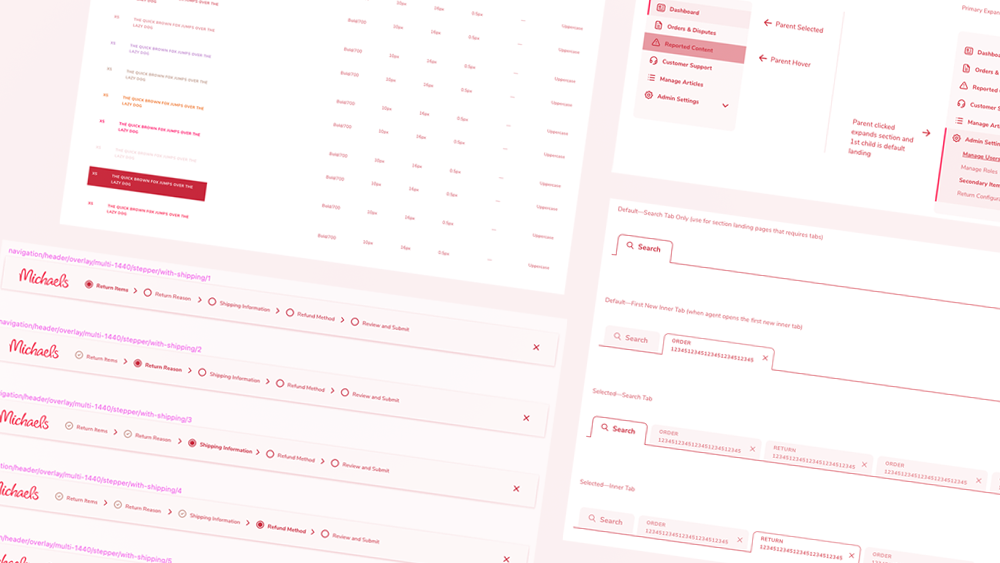
tokens, themes, components, recipes structures and team-based access

component library snippets
Solutions
collaboration with 3rd party vendor
- audited current design system
- explored and crafted potential new structures
- switched from XD to figma for greater productivity
- introduced design token to design system
collaboration with internal design system team
- advocated needs to update design system
- partnered with product owner, scrum master, and engineering team to confirm best strategy to transition to new structure, processes, and protocols for governance, education, and knowledge share
- coached and managed design system pods
- facilitated design system updates and Q&As
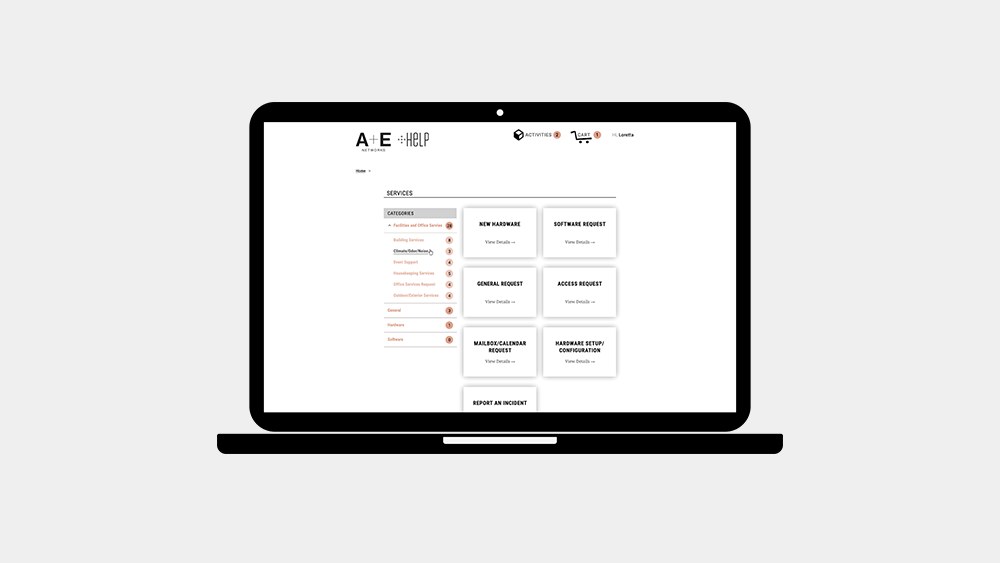
button component variant in use